Benchmarking JS-Frontend Frameworks

I must admit that this post came a bit unexpected. I just wanted to compare the performance of a few Javascript frontend frameworks and that’s where all the mess started.

What to measure

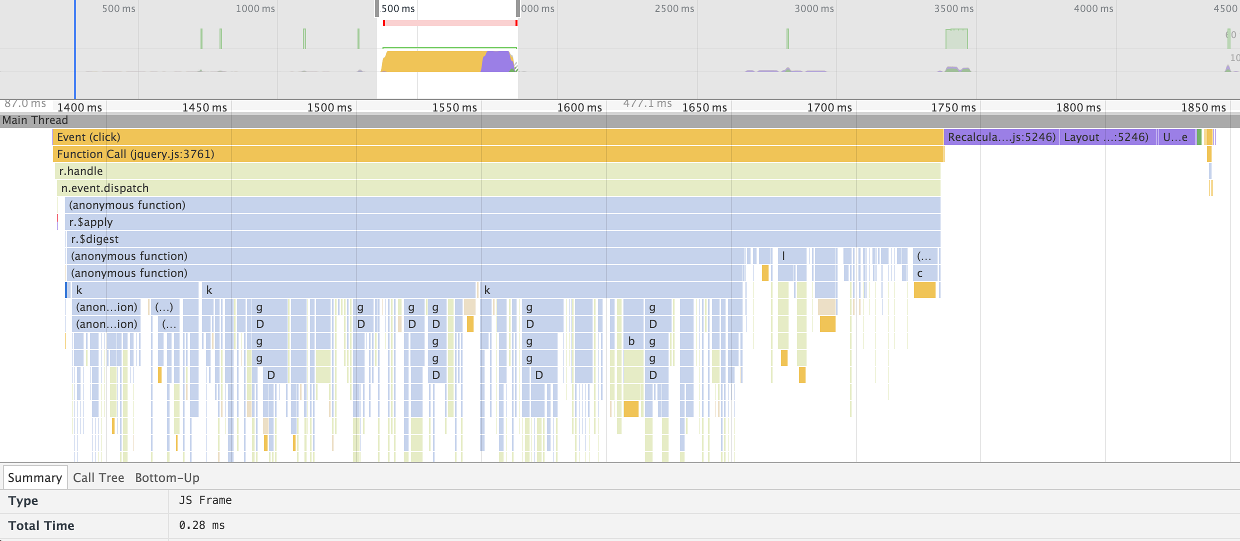
Before running a benchmark one should be clear about what to measure. In this case I wanted to know which framework is faster for a few test cases. I knew which test cases, which frameworks, which left unclear what faster actutally means. Let’s take a look at a chrome timeline:

Continue reading

C, Java and Javascript numeric benchmark and a big surprise

In older posts on this blog I showed that Java’s performance can come pretty close to C – at least for simple numeric benchmarks. Android’s Dalvik VM is often blamed for its bad performance, though things have improved since the introduction of a JIT. With all that HTML5 vs. native debate and the ongoing Javascript hype I though it would be cool to run some benchmarks and compare the performance of Java, Javascript and C on my notebook, an iPhone 4S and a Google Nexus 7.

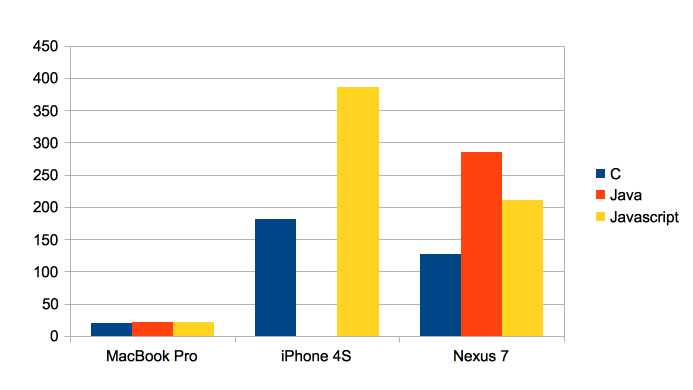
I decided to run a mandelbrot benchmark first. This time I wanted to see a nice colored mandelbrot set and found a Javascript version on http://www.atopon.org/mandel/# . I decided to bring that source code to Java and C (no SSE intrinsics, just plain C code to support all platforms). Here are the results showing the duration in milliseconds for each language and platform:Mandelbrot_CJJS

  • On the MacBook Pro the performance is within a narrow range. C wins with 19 msecs, Java is second with 21 msecs and Javascript is amazingly quick with 22 msecs.
  • On the iPhone the Javascript Nitro Engine takes 113% more time that the C version. Nevertheless almost factor 2 isn’t too bad for a dynamic language.
  • The most surprising result was on the Google Nexus 7. C was fastest, the Java code on the Davlik VM was 144% slower and the V8 Javascript engine achieved to beat the Dalvik VM significantly. The first computation was 65% slower and after that warm up subsequent computations were only 42% slower than C. Once again: V8 is much faster than Dalvik and easily within a range of 2 to C!

A single benchmark doesn’t prove anything, so why not add another well known benchmark. I took NBody (as I always did on this blog ;-)).

The results for NBody confirmed those results. For C I took the fastest plain C implementation from the Computer Language Benchmarks Game. Once again the y-axis shows the duration (this time in seconds).NBody_CJJS

  • On the MacBook Pro Javascript was 44% slower than C (Java only 1.5%).
  • The Javascript Nitro VM on my iPhone 4S was 99% slower than C.
  • On the Nexus 7 there’s once again the same image: Java is 106% slower than C, Javascript only 43%. Amazing.

For simple numeric benchmarks the performance of Javascript is simply astonishing. On the MacBook Pro Javascript is incredibly close to the performance of C and Java. On the iPhone Javascript was within a range of factor 2.1. For me it was very surprising to see V8 on Android being able to beat Java on the Davlik VM by a large margin.

Fine print:

  • Slower and faster usually cause headaches in benchmarks (There a nice paper about that http://hal.inria.fr/docs/00/73/92/37/PDF/percentfaster-techreport.pdf). I sticked with the elapsed time, such that e.g. 42% slower means that the factor of the durations was 1.42.
  • On the MacBook Pro C was compiled with clang using -O3 -fomit-frame-pointer -march=native -mfpmath=sse -msse3 for x64. Java was Oracle Hotspot 1.8.0-ea-b87 on 64 bit (thus C2 aka Server Hotspot). Chrome was 28.0.1493.0, but the 32 bit version. I tried to compile V8 myself, but both the x86 and x64 custom built V8 were significantly slower than Chrome so I stick with Chrome.
  • On the iPhone I used a release configuration using clang with (among others) -O3 -arch armv7
  • The Google Nexus 7 runs Android 4.2.2, Chrome 26.0.1410.58. C was compiled with -march=armv6 -marm -mfloat-abi=softfp -mfpu=vfp -O3.

Scalar replacement: Automatic stack allocation in the java virtual machine

The java virtual machine recently introduced a very interesting optimization that allows to eliminate some object allocations. This optimization is called scalar replacement and depends on escape analysis. You can read more about it in an article by Brian Goetz.

Simply spoken when an object is identified as non-escaping the JVM can replace its allocation on the heap with an allocation of its members on the stack which mitigates the lack of user guided stack allocation. The optimization is enabled by default since JDK 6U23 in the hotspot server compiler.
Continue reading

JDK 7 GC behavior: To free or not to free

I still remember my sysadmin’s face whenever I asked for a few GBs of RAM for some J2EE app – I guess he wasn’t a big Java fan. Times have changed in nowadays we happen to be offered more RAM than our apps reasonably needed (of course we take what we were offered ;-))

On the desktop site users are a bit more concerned about memory consumption and thus the JVM hasn’t a particular good standing when it comes to the client side. It feels alien to developers and users to specifiy a maximum memory size (-Xmx) and obscene if the JVM doesn’t even return unused memory to the OS. But the latter behavior is subject to the garbage collector in use. We’ll take a look at the behaviour of the garbage collectors of JDK 7. If you don’t know what garbage collector for JDK 7 exist then you might consider reading those references first:
Java HotSpot Garbage Collection
Understanding GC pauses in JVM, HotSpot’s minor GC.

The test class is very simple and short enough to be pasted here. It first allocates a number of int array and later releases the references and invokes the garbage collector.

public class GCTest {

	private static ArrayList data = new ArrayList<>();

	public static void main(String[] args) throws Exception {
		for (int i=0;i<700;i++) {
			data.add(new int[1 * 1024 * 1024]);
			Thread.sleep(50);
			System.out.println("Allocation # "+i);
		}

		for (int i=0;i<700;i++) {
			data.remove(data.size()-1);
			if (i%10 == 0) {
				System.out.println("(Trying to) run garbage collection");
				System.gc();
			}
			Thread.sleep(50);
			System.out.println("Deallocation # "+i);
		}
	}
}

Now we’ll take a look at the different garbage collectors available with JDK 7.

Parallel Scavenge (PS MarkSweep + PS Scavenge)

This is the default collector on my machine (Windows 7, 64 Bit, JDK 7 64 Bit). It’s a parallel throughput collector and can be selected by passing “-XX:+UseParallelOldGC”. This collector appears not to return any memory to the OS. Here’s the heap graph from VisualVM. The blue line shows the amount of heap used by the test program. The orange line shows how much memory the JVM has allocated from the OS for the heap. Finding out the “real” memory consumption is a science on its own, but for the sake of simplicity we’ll take the working set as displayed by the Process Explorer as the memory usage.

CMS – Concurrent Mark And Sweep (ConcurrentMarkSweep + ParNew)

Turn it on with “-XX:+UseConcMarkSweepGC”. CMS is a low pause collector. It also refused to return any memory.

Serial GC (Copy + MarkSweepCompact)

You switch it on with “-XX:+UseSerialGC”. The serial GC doesn’t sound very sexy in times of multicore hardware, but it’s the first GC to release memory to the OS. Nice start!

Parallel New + Serial GC (ParNew + MarkSweepCompact)

The serial collector for the old generation can be spiced up with a parallel collector for the new generation. Use “-XX:+UseParNewGC” for that combination. The nice thing is it keeps the nice behaviour of Serial GC and returns memory to the OS.

If you use the Serial GC you can even influence the resizing behavior with the MinHeapFreeRatio and MaxHeapFreeRatio VM arguments. Serial GC appears to be the only GC that actually respects that arguments. Here’s an example with “-XX:+UseParNewGC -XX:MinHeapFreeRatio=5 -XX:MaxHeapFreeRatio=10”.

This results in a very nice and close relation between used heap and allocated heap size. But of course you must consider the additional costs for adjusting the heap size often.

G1 (G1 Old Generation, G1 Young Generation)

The newest garbage collector can be turned on with “-XX:+UseG1GC”. It works quite different from all other collectors and as far as I know is intended to replace the CMS collector. It has the very nice property that it also returns free memory! The not nearly linear blue line might be due to G1’s only recent support in VisualVM.

Conclusion

Only the Serial GC and G1 release unused memory to the OS. I’m pretty happy to see that the new G1 does behave better that its predecessors. If memory consumption matters for your application and your app has memory peaks you might consider one of those collectors.
I’m interested in hearing your experiences with those GCs.

Update: Process Explorer view (in response to Kirk Pepperdine)

Here’s a graph from process explorer for the G1 test case. If you look at the figures displayed in the process tab you’ll confirm that both the private bytes from virtual memory and the working set are first growing and then shrinking. The numbers are of course higher than the heap size due to perm gen, code cache, non heap memory etc.
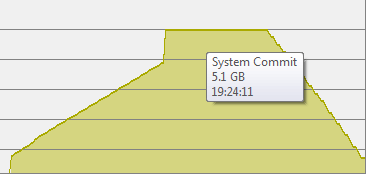
And here’s the graph for CMS. As you see all memory is kept by the VM.

Update For Java Benchmark

About half a year ago I published my first results for a C vs. JVMs benchmark. Some version updates appeared since then and so I thought it’s time for another run.

Some words about the benchmarks

Four of the five benchmarks stem from benchmarks found on the The Computer Language Benchmarks Game. They have been modified to reveal the peak performance of the virtual machines, which means that each benchmark basically runs 10 times in a single process. The first run might be negatively influenced by the JIT compiler and isn’t counted and only the remaining 9 times are used to compute the average duration.
The fifth benchmark is called “himeno benchmark” and was ported from C code to java. Himeno runs long enough such that the warm up phase doesn’t matter much.

Compilers and JVMs used in this comparison

  • GCC 4.2.3 was taken as a performance baseline. All programs were compiled with the options “-O3 -msse2 -march=native -mfpmath=387 -funroll-loops -fomit-frame-pointer”. Please note that using profile guided optimizations might improve performance further.
  • LLVM has just released version 2.3 and is a very interesting project. It can compile c and c++ code using a GCC frontend to bytecode. It comes with a JIT that runs the bytecode on the target platform (aditionally it even offers an ahead of time compiler). It is used for various interesting projects and companies like most noteably apple for an OpenGL JIT and some people seem to work on using LLVM as a JIT compiler for OpenJDK. I used the lli JIT compiler command with the options -mcpu=core2 -mattr=sse42.
  • IBM has released it’s JDK 6 with it’s usual incredible bad marketing (of course there’s no windows version yet). I’ve used JDK 6 SR1, but I couldn’t find a readable list of what changes it includes. The older IBM JDK 5 is also included to see if it was worth the wait.
  • Excelsior has released a new version of it’s ahead of time compiler JET. Both version 6.0 and 6.4 have been benchmarked. JET is particularly interesting because it combines fast startup time and high peak performance and is therefore just what you’d expect from a good desktop application compiler.
  • Apache Harmony is also included in the benchmark. It’s aimed to become a full APL licenced java runtime and used for the google android platform. Recently the Apache Harmony Milestone 6 was released. I’ve taken a look at this version’s performance in this blog.
  • BEA JRockit is no longer included due to a great uncertainness about it’s current and future availability. A short period after Oracle bought BEA all download links were removed from the web page. A few days ago it was announced that JRockit will no longer be available as a standalone download.
  • SUN’s JDK 6 Update 2 and Update 6 were put to the test with the hotspot server compiler (i.e. -server option).
  • All benchmarks were measured on my Dell Insprion 9400 notebook with 2GB of RAM and a intel Core 2 running at 2GHz under Ubuntu 8.04 (x86).

Continue reading

Java vs. C benchmark #2: JET, harmony and GCJ

In one of the comments regarding my Java vs. C benchmark Dmitry Leskov suggested including Excelsior JET. JET has an ahead of time compiler and is known to greatly reduce startup time for java applications. I’ve kept an eye on JET since version 4 or so and while the startup time has always been excellent the peek performance of the hotspot server compiler was better. With JET 5 performance for e.g. scimark has improved greatly so I decided to rerun the benchmark for JET 5 and JET 6 beta 2. JET 6 beta 2 is currently available on windows only and thus the tests were run under Windows Vista, JET 5 (and all other VMs) ran under Ubuntu. I also benchmarked JET 5 on Windows to check if there’s a large OS-related difference, but the results were within 2.4% (still a t-Test showed a significant difference). As a simplification I decided to publish only the Ubuntu JET 5 results. Nevertheless I’ll update the results when beta 3 becomes available for linux.

Another interesting VM is Apache Harmony. It is designed to be a complete open source JDK and it received a lot of attention when it started (and it became pretty quite nowadays). It started before Sun decided to open their JDK under the GPL, so if nothing else harmony was in my opinion one of the reasons that we have Sun’s openjdk project now. Harmony’s VM is based on a intel donation so that alone makes benchmarking interesting. Of course Harmony is still in the early stages and it would be almost a miracle if Harmony 1.0 could beat the performance of Sun’s JDK.

The third VM is also an ahead of time compiler. GCJ is a java frontend for the GCC and thus might produce code roughly identical to GCC. There isn’t too much publicity for GCJ despite its effort to become a really usable JVM. Combined with the GIJ interpreter and the gcj-dbtool GCJ is able to compile even complex applications like eclipse. GCJ uses classpath as its underlying implementation of the JDK classes which means some parts of the JDK are still missing. I decided to use the Ubuntu gcc 4.3 snapshot as it turned out to work best on my PC. Continue reading

Java vs. C benchmark

Java’s performance is perceived rather differently depending on who you ask ranging from Java-is-faster-than-C to “java is 10x slower”.
Without actually running some benchmarks it’s hard to tell who is actually right and of course every benchmark will show different results and both sides have good arguments. I don’t know of any real world applications that has been ported from C to Java in such a way that statements about their relative performance are valid. So the only source I know are (micro-)benchmarks. Besides the well known Scimark and linkpack benchmarks there are some interesting benchmarks on the “computer language benchmark game” formerly known as the great language shootout. It has often been criticized for too short duration and including warmup times for JITs. Still I like those benchmarks since they are not classic microbenchmarks, but (almost) every benchmark tries to stress a certain set of language features and returns a well defined output.
To make it short: I decided to select four computational intensive, IO-less benchmark from the shootout. Continue reading