The java virtual machine recently introduced a very interesting optimization that allows to eliminate some object allocations. This optimization is called scalar replacement and depends on escape analysis. You can read more about it in an article by Brian Goetz.
Simply spoken when an object is identified as non-escaping the JVM can replace its allocation on the heap with an allocation of its members on the stack which mitigates the lack of user guided stack allocation. The optimization is enabled by default since JDK 6U23 in the hotspot server compiler.
While all that sounds exciting the question is how well it actually works. I’ll show you some simplified code from my personal pet 3D project. In 3D graphics you usually have lists of vectors for vertices, normals and so on. Using an array of 3D vector objects has substantial memory overhead and leads to uncertain performance, since the vector objects could be placed anywhere on the heap and even be reordered with the next garbage collection which would cause a poor cache usage. Thus it’s better to create a dedicated list that holds the vectors in a float array and offers methods that translate between the array and the vector objects. Of course that would result in horrible GC pressure if new objects were created all the way. This scenario sounds perfect for scalar replacement, since the methods are short enough to be inlined and the objects often don’t escape.
Let’s look at some code. The VectorList is the translator between the array and returns new Vector instances for the get method.
public class VectorList {
	private float[] data;
	private int size;

	public VectorList(int size) {
		data = new float[size*3];
		this.size = size;
	}

	public Vector get(int index) {
		return new Vector(data[index*3],
				data[index*3+1],
				data[index*3+2]);
	}

	public void set(int index, Vector v) {
		data[index*3] = v.x;
		data[index*3+1] = v.y;
		data[index*3+2] = v.z;
	}

	public int size() { return size; }
}
Vector is immutable, has some basic math operations and looks like that:
public class Vector {

	public final float x, y, z;

	public Vector(float x, float y, float z) {
		this.x = x;
		this.y = y;
		this.z = z;
	}

	public float dot(Vector v) {
		return x*v.x + y*v.y + z*v.z;
	}

	public Vector scale(float s) {
		return new Vector(x*s, y*s, z*s);
	}

	public Vector add(Vector v)
	{
		return new Vector(x + v.x, y + v.y, z+v.z);
	}

	public Vector normalize() {
		float norm = (float)
				(1.0/Math.sqrt(x*x +
						y*y + z*z));
		return new Vector(x*norm, y*norm, z*norm);
	}

	public static Vector cross(Vector v, Vector w) {
		float x = v.y*w.z - v.z*w.y;
		float y = w.x*v.z - w.z*v.x;
		float z = v.x*w.y - v.y*w.x;
		return new Vector(x, y, z);
	}
}
The method that stresses both classes looks like that:
...
VectorList normals;
VectorList tan;
VectorList cot;
...
public void compute() {
        for (int a=0; a
All lines that cause a new Vector to be created are commented "alloc". What would you guess how many allocations are performed after scalar replacement? Amazingly not a single allocation!
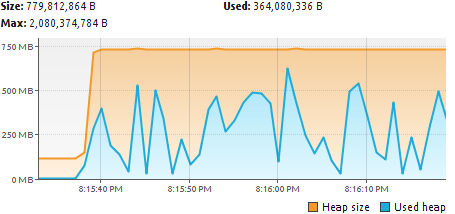
Here's a view from jvisualvm when escape analysis is disabled:

And here it is when escape analysis is enabled.


(The used heap is still slightly rising which ist due to code in the test driver that prints some of the results.)
If you want to check yourself which allocations were eliminated you have to build yourself a debug version of the JVM and invoke it with -XX:+PrintEliminateAllocations (thanks to Spasi for that hint). It'll print the byte code index for which an allocation was eliminated.
Amazing, isn't it?

