Here’s a follow-up to my last blog post since there’s good reason for an update:
- It turned out that ember performs better with ‘key=”identifier”‘ in the #each helper.
- One of the vue.js creators contacted me and told me that they fixed vue.js in response to the my benchmark
- Two other react-like libraries were added: Preact and react-lite
Here’s the new measurement showing the duration in milliseconds:
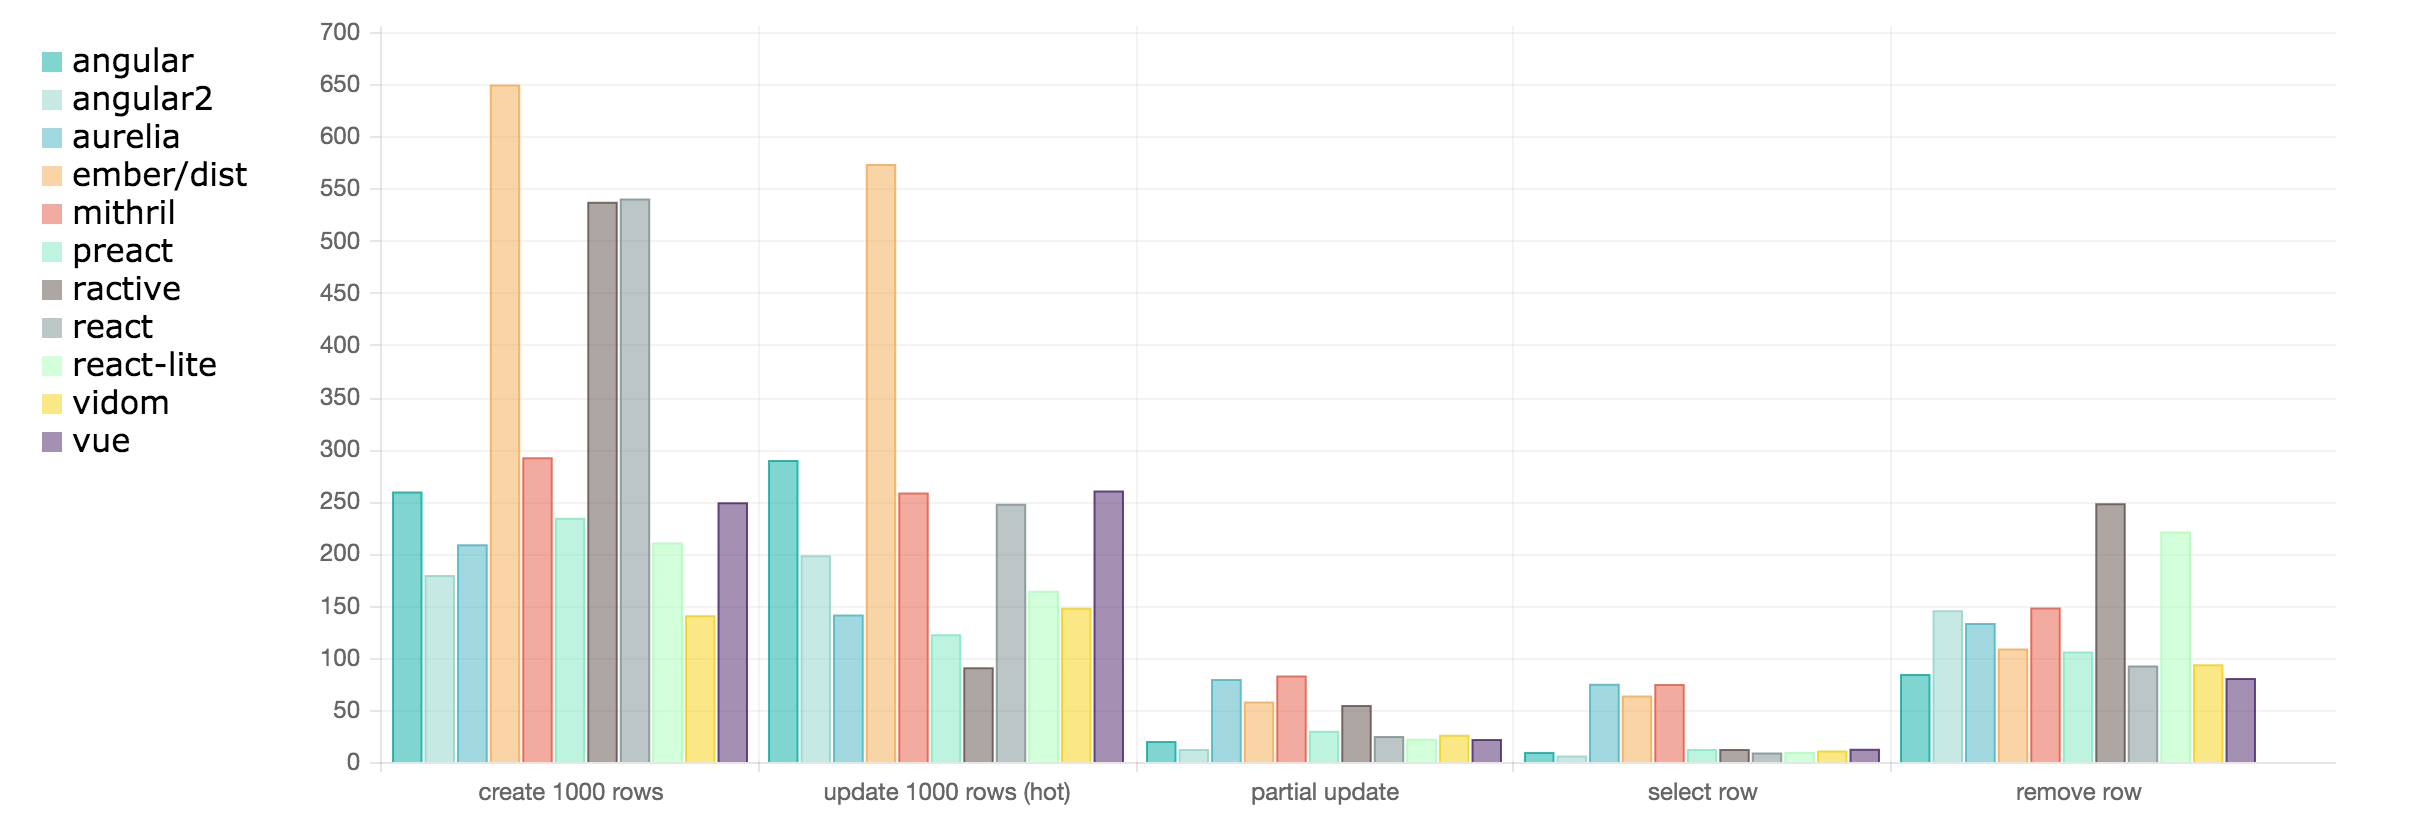
(Click the image to see the graph in full size)
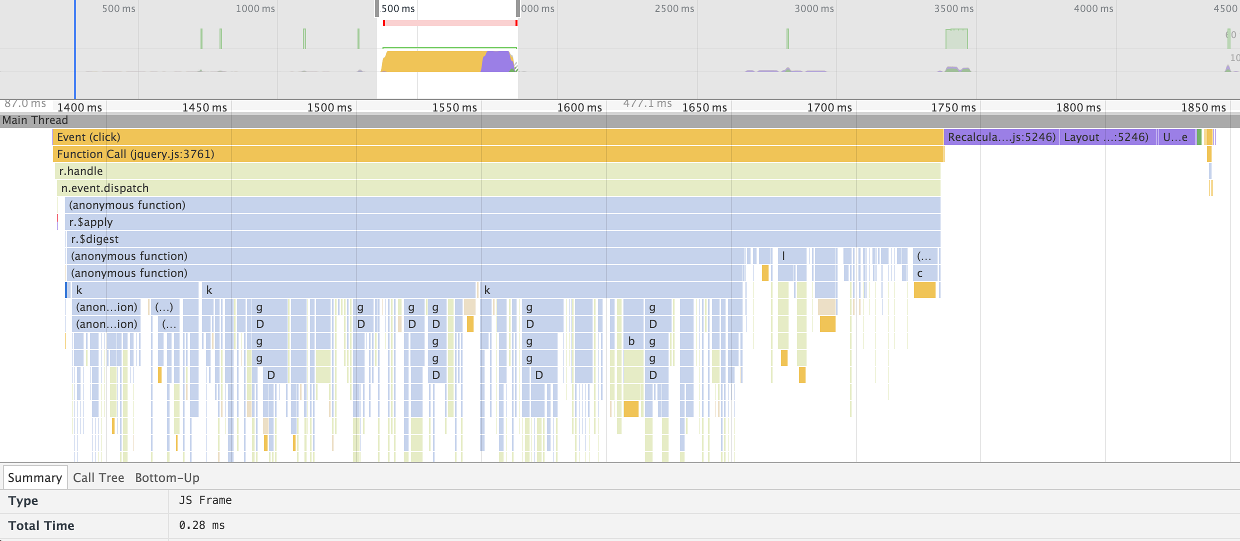
The duration is measured from the beginning of the dom click event to the end of repainting and thus includes javascript execution, rendering and layout duration. If you want to read more about it please check the according blog entry. All tests are run via a selenium test and multiple samples are taken and averaged (after removing the worst measurement). The full description for the benchmarks can be found in round 1.
And the new conclusions:
- Ember got much faster for “partial update” (from 164 msecs to 58 msecs), but is still quite slow for create or update 1000 rows.
- Vue.js improved a lot for the “update 1000 rows (hot)” benchmark (from 435 msecs to 260 msecs)
- Preact leaves quite a good impression. It’s a lot faster than react for create 1000 rows and update 1000 rows and not much slower for the rest.
- Almost the same can be said about react-lite though the performance for “remove row” is rather weak.
All in all especially angular 2, vidom and preact impress with their performance. Still aurelia feels much faster in the browser than in the selenium tests (except for startup duration which might be my fault not using the bundler correctly). And yes, vue.js is now pretty close to the fastest frameworks.
You can view the benchmarks in the browser and find all source code on github.