
I must admit that this post came a bit unexpected. I just wanted to compare the performance of a few Javascript frontend frameworks and that’s where all the mess started.
What to measure
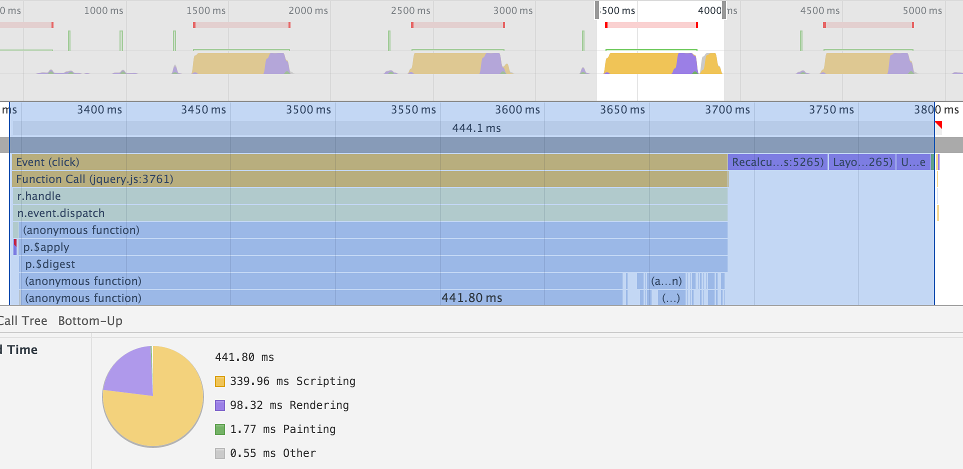
Before running a benchmark one should be clear about what to measure. In this case I wanted to know which framework is faster for a few test cases. I knew which test cases, which frameworks, which left unclear what faster actutally means. Let’s take a look at a chrome timeline:
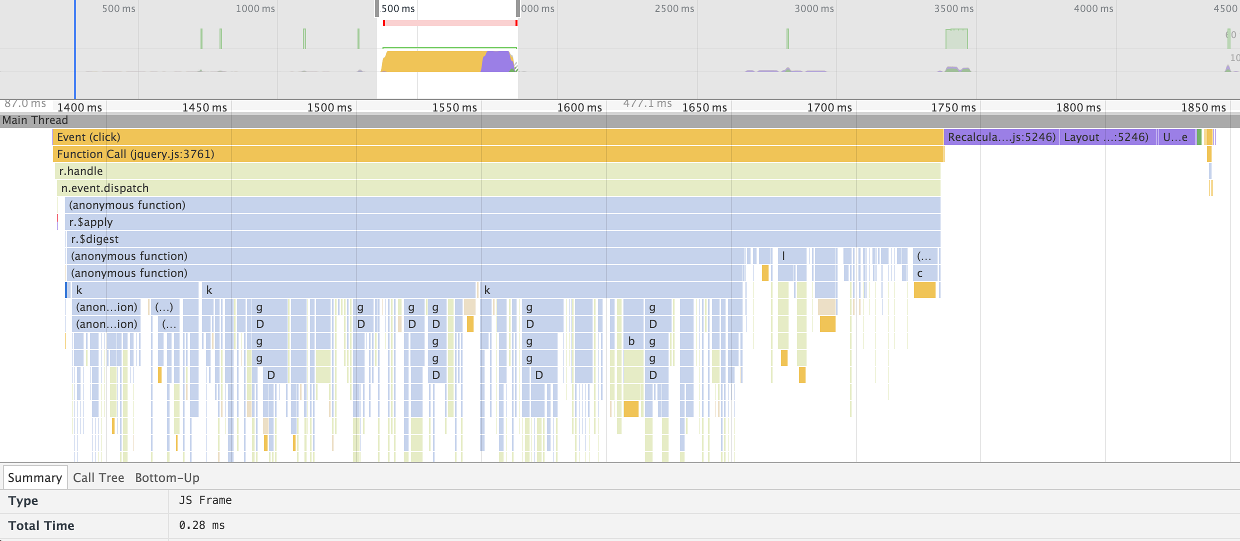
The timeline consists of three relevant parts.
The first is the yellow line labeled “Event (click)”. Digging deeply enough one can find the method in the controller that performs the model changes that should be benchmarked. In this case the “run” method of an angular controller is the very small dark blue line below r.$apply, which took 0.28 msecs.
Right after the event handling three purple lines show up. Purple is used in chrome’s timeline to signify rendering.
The third line is pretty small again and green, which stands for painting.
For the purposes of that benchmark I’d like to measure the duration from the start of the dom event to the end of the rendering. The relevant selection of the timeline is shown below. Chrome reports a duration of 461 msecs for that.

Frameworks using Request Animation Frame
Some frameworks queue dom manipulations and perform the dom updates in the next animation frame.
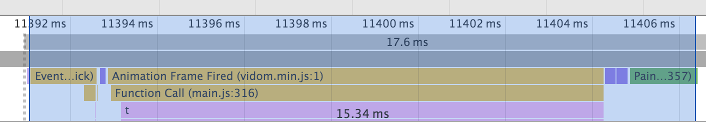
To get a somewhat fair comparison the complete duration should be taken, since that is how long the user has to wait for the screen update.
How to measure?
So far we’ve seen that the desired duration can be extracted manually from the timeline. Of course a manual extraction is exactly what we don’t want when running a benchmark, since we want to repeat the benchmark to reduce sampling errors. What tools could automate the measurement?
Framework Hooks
Angular offers $postdigest, react has componentDidMount / -Update. These methods are called after the dom-nodes have been updated. As can be seen here it doesn’t include rendering and painting.
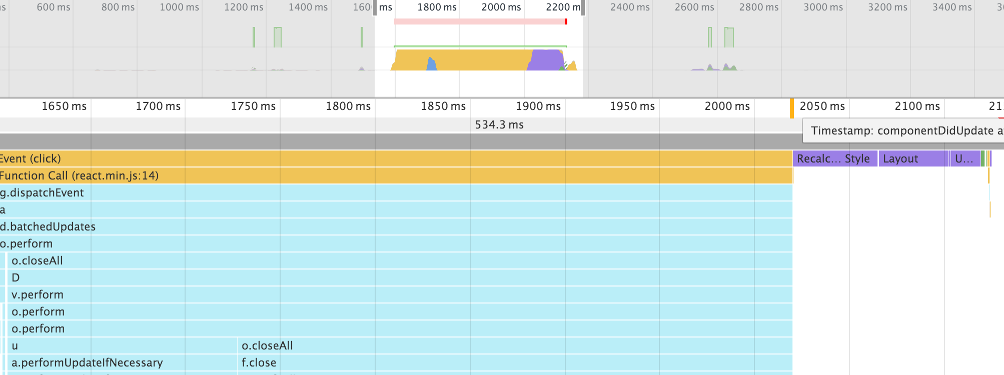
The yellow line close to 2050 ms is created with a console.timeStamp in a componentDidMount callback.
window.setTimeout
Though there’s not really a guarantee that the callback is executed after rendering and even if that works there’s a decent race condition for request animation based frameworks it works not too bad (except for aurelia), especially if window.setTimeout is called in a framework hook like componentDidMount.
The worst thing about it is that it’s not really suitable for automation.
Benchpress (part of Angular)
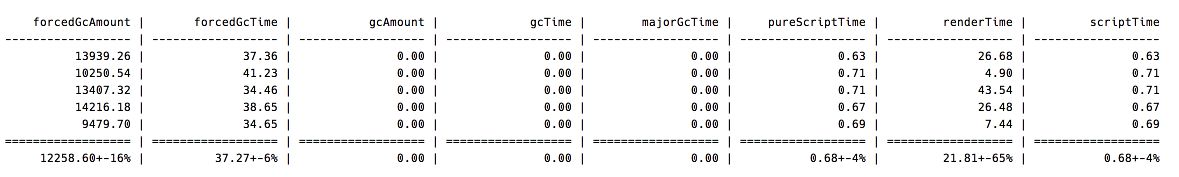
Benchpress is a tool that can take a protractor test and measure the duration of a test. It reports “script execution time in ms, including gc and render”, which sounds pretty much like what we want. So far, so good. Here’s the result of one action (which updates all 1000 rows of a table):
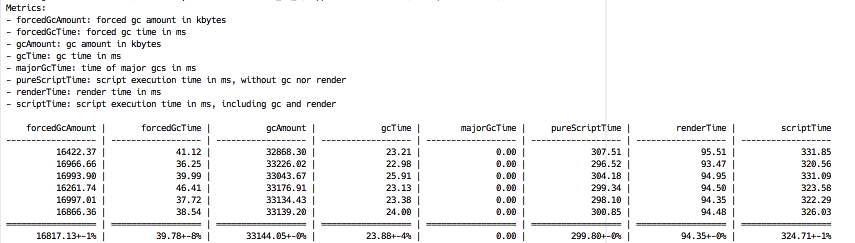
When running in the browser the timeline looks like that for a single run:
I failed to map those numbers to chrome’s timeline. If you can please don’t hesitate to enlighten me. How come scriptTime can be smaller than pureScriptTime plus renderTime? Why is pureScriptTime smaller than “Scripting” in the timeline for all cases I checked?
Benchpress has a very hard time measuring the aurelia benchmarks. Aurelia might be fast, but certainly not that fast:
There are a few other automated benchmarking tools like protractor-perf or browserperf, but I found them harder to use and the reported numbers weren’t better comprehensible for me.
A custom solution
So I found that selenium webdriver can report the raw performance log entries from chrome’s timeline. If I measure the duration from the start of the “EventDispatch” to the end of the first following “Paint” I can get very close to the expected duration. The aurelia framework is pretty special, since it first runs the business logic, does a short paint, waits for a timer to fire and then updates and re-renders the dom, which looks like that:
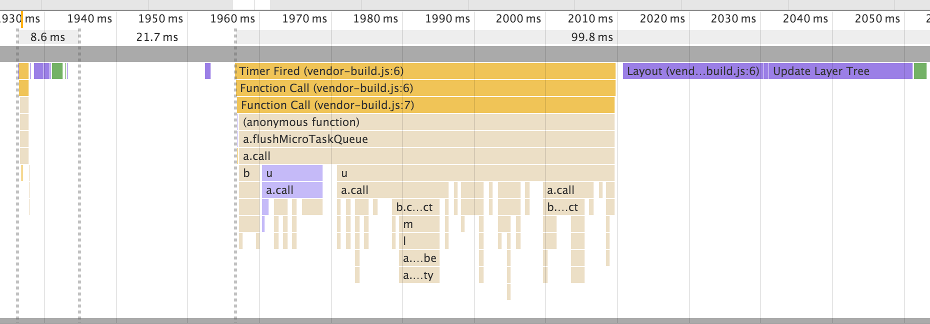
The model is updated at about 930 msecs, the the timer is fired ~22 msecs later. In this case I’d like to report a duration of ~127msecs. This can be solved by introducing a special case for aurelia that the first paint after a timer fired event should be taken. The code for the java test driver can be found in my github repository.